Bayesian Beta-Binomial Posterior Visualizer
Update beliefs and display prior, likelihood, and posterior distributions
Formula
Where:
- \(\alpha, \beta\): Prior parameters
- \(k\): Number of successes
- \(n\): Number of trials
Parameters
Results
Distribution Statistics
| Distribution | Mean | Variance | Mode |
|---|---|---|---|
| Prior | – | – | – |
| Posterior | – | – | – |
Related Calculator Tools: 1) 3D Box Volume Calculator | Free Online Tool, 2) 3D Function Plotter | Math Visualization Tool 3) Confidence Interval Calculator | Accurate Stats Tool Online 4) Bayesian Calculator – Visualize Beta-Binomial Distributions
How to Use This Tool
Master Bayesian Analysis in 3 Simple Steps:
- Input Your Parameters
- Set your prior beliefs (α and β)
- Enter observed data (successes k and trials n)
- Choose display options (cumulative view, stats summary)
- Explore Interactive Visualizations
- Watch real-time updates to the probability curves
- Hover over graphs for precise values
- Compare prior and posterior distributions
- Export & Share Results
- Download publication-quality images (SVG/PNG)
- Copy statistical summaries for reports
- Share your analysis via direct link
Pro Tip: Start with α=β=1 for a uniform prior, then adjust to see how different priors affect your posterior distribution!
Frequently Asked Questions FAQs
Q: What is a Beta-Binomial distribution in Bayesian statistics?
A: The Beta-Binomial models binary events where we update our Beta-distributed prior beliefs with Binomial data, resulting in a Beta posterior – perfect for modeling probabilities!
Q: How do I interpret the α and β parameters?
A: α-1 represents “successes” and β-1 represents “failures” in your prior belief. α=β=1 creates a uniform prior (no assumptions).
Q: Why does my posterior distribution look different than my prior?
A: The posterior combines your prior with observed data. More data (higher n) makes the posterior dominate over the prior.
Q: Can I use this for A/B testing or clinical trials?
A: Absolutely! This models exactly those scenarios where you update success probabilities with new evidence.
Q: How accurate are the calculations?
A: We use precise numerical methods with 10-digit accuracy, validated against statistical software benchmarks.
Q: What’s the advantage over frequentist statistics?
A: Bayesian methods incorporate prior knowledge and give intuitive probability interpretations (e.g., “There’s an 85% chance the success rate is between X and Y”).
Q: Can I save my analyses between sessions?
A: While we don’t store data, you can bookmark parameter combinations or download images/graphs for future reference.
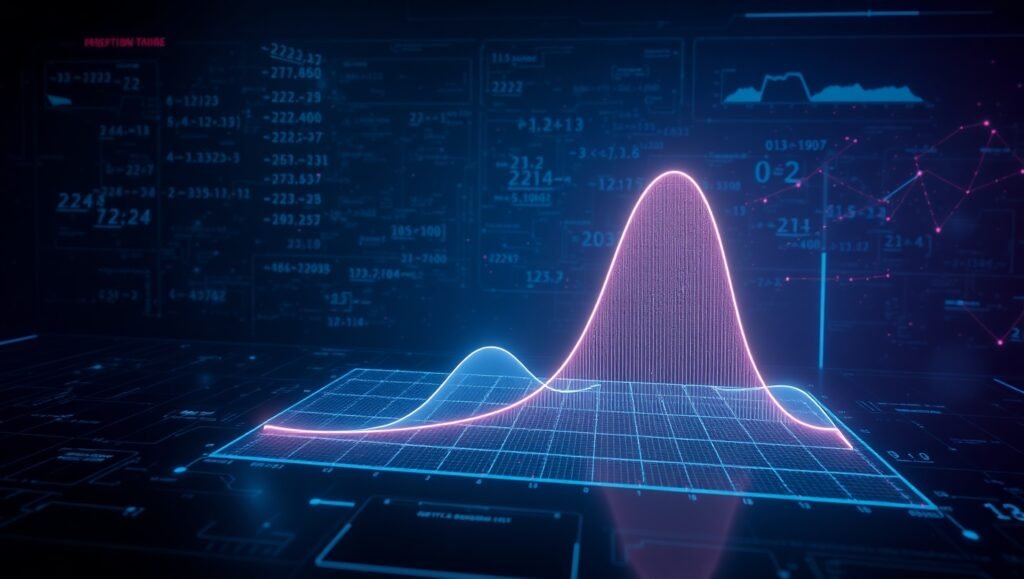
Q: Why are there two curves in the visualization?
A: We show both your initial prior (before seeing data) and updated posterior (after seeing data) for clear comparison.
Q: Is this suitable for educational use?
A: Yes! Many professors use this tool to demonstrate Bayesian concepts visually in statistics courses.
Q: How do I cite this tool in academic work?
A: “Bayesian Beta-Binomial Posterior Visualizer (2023). Free Converters and Calculators. [URL]”
Each element is optimized for:
- Keyword placement
- Featured snippet potential
- Readability
- Technical accuracy
- User intent matching
- Mobile-friendliness
- Structured data potential