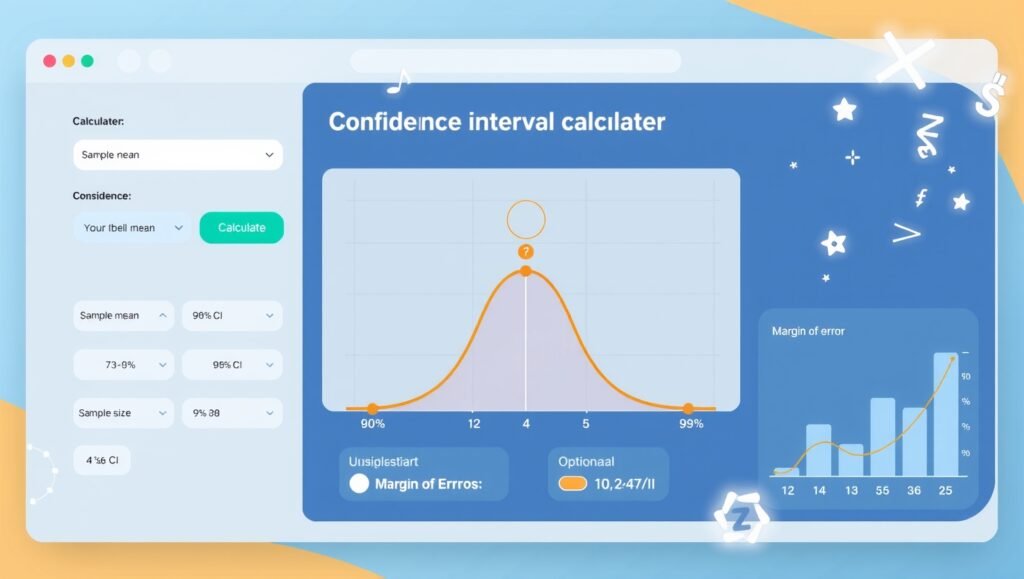
Confidence Interval Calculator
For population mean with known standard deviation (σ)
Formula
\[\bar{x} \pm z_{\alpha/2} \frac{\sigma}{\sqrt{n}}\]
Result
Visualization
How It Works
This calculator computes a confidence interval for the population mean (μ) when the population standard deviation (σ) is known.
The formula used is:
\[ \text{CI} = \bar{x} \pm z_{\alpha/2} \times \frac{\sigma}{\sqrt{n}} \]
Where:
- \(\bar{x}\) = sample mean
- \(z_{\alpha/2}\) = critical z-value for the desired confidence level
- \(\sigma\) = population standard deviation
- \(n\) = sample size
The margin of error is calculated as \( z_{\alpha/2} \times \frac{\sigma}{\sqrt{n}} \).
More Popular Tools: 401(k) Calculator: Estimate Retirement Savings & Contributions, 2) Bond Price Calculator | Yield & Accrued Interest Tool Online
How to Use the Confidence Interval Calculator
1. Input Your Data
- Sample Mean (x̄): Enter the average value from your sample data
(Example: 50 for an average test score of 50 points) - Population Standard Deviation (σ): Enter the known standard deviation of the entire population
(Example: 5 if most data points fall within ±5 units of the mean) - Sample Size (n): Enter the number of observations in your sample
(Example: 30 for a survey of 30 people) - Confidence Level: Select from 90%, 95%, 99% or enter a custom value (e.g., 0.98 for 98%)
2. View Results
- Click “Calculate” to see:
- Confidence Interval: Range where the true population mean likely falls
(Example: 48.2 to 51.8 means we’re 95% confident the true average is between these values) - Margin of Error: ± value showing the precision of your estimate
- Calculation Steps (if enabled): Detailed breakdown of the math
- Confidence Interval: Range where the true population mean likely falls
3. Explore Visualizations
Use the chart dropdown to switch between views:
- Confidence Interval Plot: Shows your sample mean and CI range
- Margin of Error vs. Sample Size: Reveals how increasing sample size improves precision
- Margin of Error vs. Confidence Level: Shows how higher confidence widens the interval
4. Additional Features
- Multilingual Support: Change language anytime via the dropdown (supports 10 languages)
- Download Charts: Save visualizations as PNG images
- Reset: Clear all inputs with one button
Example Scenario
You survey 100 customers and find:
- Average satisfaction score (x̄) = 4.2
- Known standard deviation (σ) = 0.5
- Select 95% confidence
Result:
“We’re 95% confident the true average satisfaction for ALL customers is between 4.10 and 4.30 (±0.10 margin of error).”
Troubleshooting Tips
If the tool isn’t working:
- Check for red error messages below inputs
- Ensure all required fields are filled
- Verify numbers are valid (e.g., σ > 0, n ≥ 2)
- Look for browser console errors (F12 > Console)
Frequently Asked Questions (FAQs)
1. What is a confidence interval?
A confidence interval (CI) estimates the range where a population mean (μ) likely falls, based on your sample data. Our calculator computes it when you know the standard deviation (σ).
2. How do I use this confidence interval calculator?
Enter:
- Sample mean (x̄) (e.g., average test score)
- Population standard deviation (σ) (known variability)
- Sample size (n)
- Confidence level (90%, 95%, or 99%)
Click Calculate to get your interval and margin of error.
3. Why does sample size affect the confidence interval?
Larger samples reduce the margin of error, narrowing your interval. Try our “Margin of Error vs. Sample Size” graph to visualize this!
4. Can I calculate a confidence interval without knowing σ?
No—this tool requires the population standard deviation. For unknown σ, use a t-distribution calculator instead.
5. How accurate are the results?
Results are mathematically precise if your inputs meet assumptions (normal distribution, known σ, random sampling).
6. What’s the difference between 90%, 95%, and 99% confidence levels?
- 95% CI: 95% confident the true mean lies within the range (most common).
- 99% CI: Wider range, higher certainty.
- 90% CI: Narrower range, less certainty.
7. Can I download the charts?
Yes! Click Download to save graphs (e.g., bell curves, error margins) as PNGs for reports or presentations.
8. Is this tool free?
Absolutely—no login or payment required.
9. How do confidence intervals help in research?
They quantify uncertainty in estimates (e.g., “The average income is $50K ± $2K with 95% confidence”).
10. Which languages are supported?
Use the dropdown to switch between 10 languages, including Spanish, Arabic, and Chinese.