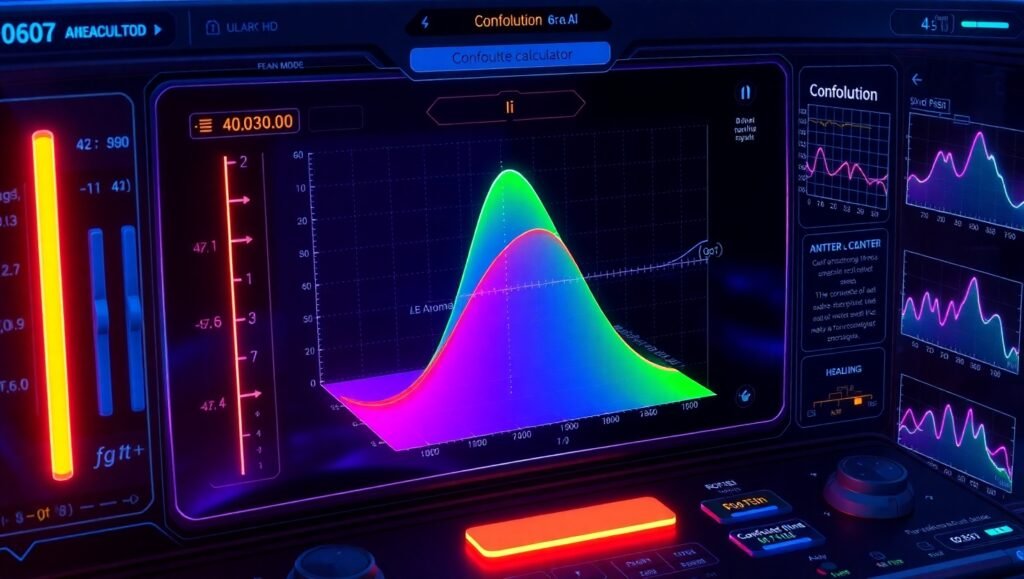
Discover how convolution works in signal processing with our free Interactive Convolution Calculator at freeconvertersandcalculators.com/interactive-convolution-calculator-visualize-signal-processing/. This powerful tool helps students, engineers, and researchers visualize the convolution of two functions in real time, making complex mathematical concepts easier to understand.
With dynamic animations, you can see the flipping, sliding, and integration process that defines convolution, a fundamental concept in Fourier transforms, digital signal processing (DSP), and system analysis. Adjust parameters, choose different functions (rectangular, triangular, sine wave, or custom inputs), and watch as the tool calculates and displays the resulting convolution.
Key features:
✔ Real-time graph updates
✔ Step-by-step animation
✔ Custom function support
✔ Interactive sliders for precise control
✔ Downloadable results for study and presentations
Whether you’re learning DSP, preparing for exams, or working on engineering projects, this tool simplifies convolution with visual, hands-on learning. Try it now and enhance your understanding of signal processing!

Related Calculator Tools: 1) 3D Box Volume Calculator | Free Online Tool, 2) 3D Function Plotter | Math Visualization Tool 3) Confidence Interval Calculator | Accurate Stats Tool Online 4) Bayesian Calculator – Visualize Beta-Binomial Distributions, 5) Interactive Convolution Calculator – Visualize Signal Processing, 6) Fourier Transform Calculator | Signal Analysis Tool Online