Hypothesis Test Power Curve
Related Calculator Tools: 1) 3D Box Volume Calculator | Free Online Tool, 2) 3D Function Plotter | Math Visualization Tool 3) Confidence Interval Calculator | Accurate Stats Tool Online 4) Bayesian Calculator – Visualize Beta-Binomial Distributions, 5) Interactive Convolution Calculator – Visualize Signal Processing, 6) Fourier Transform Calculator | Signal Analysis Tool Online 7) Random Walk & Brownian Motion Simulator – Visualize Paths 8) Power Curve Calculator | Visualize Hypothesis Test Errors
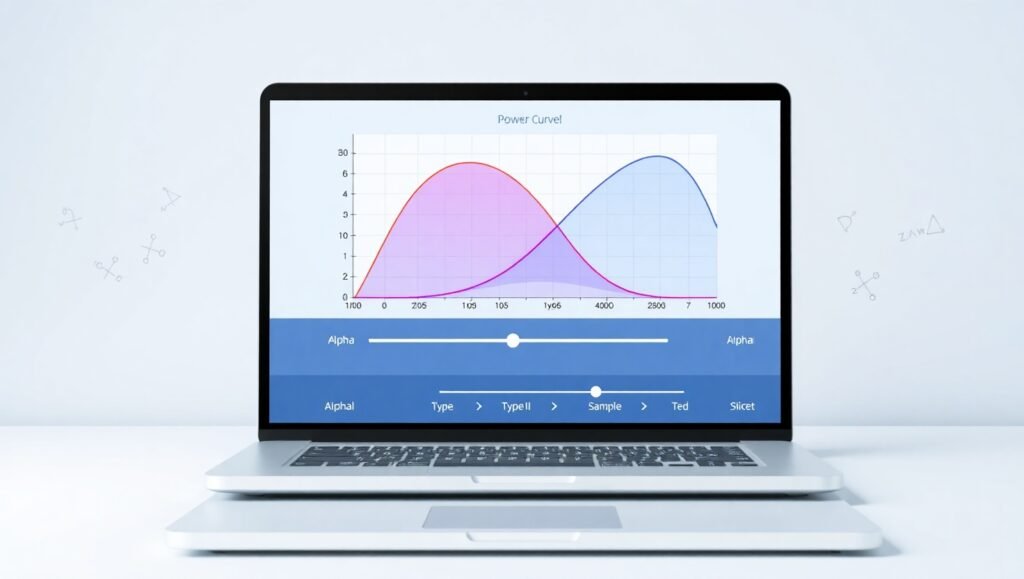
How to Use Power Curve Calculator | Visualize Hypothesis Test Errors
“Simply adjust the three key parameters using our intuitive sliders:
- Set your desired significance level (α) – typically 0.05
- Enter your expected effect size (Cohen’s d)
- Input your planned sample size
Our tool instantly calculates and displays:
- Statistical power (1-β)
- Type II error rate (β)
- Visual representation of both distributions
- Clear demarcation of error regions
Perfect for researchers, students, and analysts to:
✓ Plan study sample sizes
✓ Understand statistical power
✓ Visualize error trade-offs
✓ Validate experimental designs”
FAQs: Power Curve Calculator
Q: What is statistical power in hypothesis testing?
A: Statistical power (1-β) represents the probability of correctly rejecting a false null hypothesis. Our tool helps you visualize and calculate this crucial metric.
Q: How does sample size affect power?
A: Larger sample sizes increase statistical power, making it easier to detect true effects. The tool shows this relationship graphically as you adjust values.
Q: What’s a good power value to aim for?
A: Most researchers target 80% power (0.8), meaning an 80% chance of detecting an effect if it exists. Our visualization helps you find the right balance.
Q: Can I use this for my thesis research?
A: Absolutely! This tool is perfect for academic research, helping you justify sample sizes and understand potential errors in your statistical analysis.
Q: How accurate are the calculations?
A: We use precise statistical algorithms (jStat library) to ensure professional-grade accuracy in all power calculations and visualizations.
Q: Is there a mobile version?
A: Yes! Our responsive design works perfectly on all devices – smartphones, tablets, and desktops.
Q: Do I need to install anything?
A: No installation needed – it runs completely in your web browser with no downloads required.